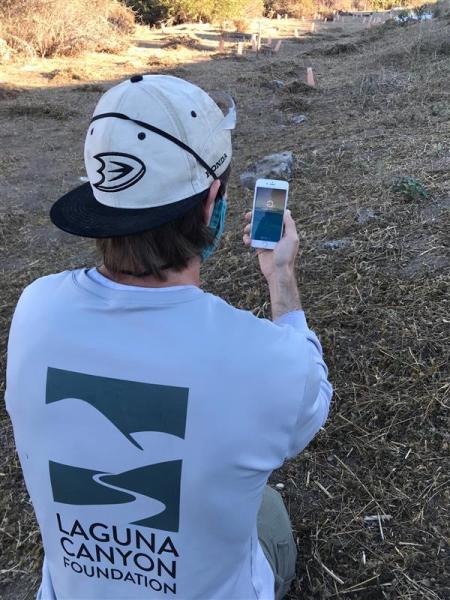
In this my second year as a restoration technician at Laguna Canyon Foundation, people have started calling me “CoreyMaps,” and I’m fine with that.
Since 2015, I’ve loved maps. My journey started while working for the City of Dana Point where, as a Natural Resources Intern, I created maps for the distribution of the endangered Pacific Pocket Mouse, Argentine Ants and Coastal California Gnatcatchers.  Being out in the field collecting data and analyzing it back at the office piqued my interest in seeking answers to various natural resource questions. I started taking classes at Saddleback College which eventually led me to receiving a certificate in GIS and Cartography from California State University, East Bay.
Restoring native habitat involves a lot of science, thoughtful collaboration, extensive physical work, a little art and finesse, and a whole bunch of data.
Today is National GIS Day. GIS or “Geographic Information Systems” is a digital system for storing and analyzing geographical data and it is critical for the work we do to preserve our wilderness, watersheds and natural resources.
Picture a group of restoration techs removing Arundo Donax (a tall reed-like, stubborn invasive plant) along Aliso Creek. As we’re working, we might notice some pampas grass (another invasive species) or hear a California Gnatcatcher (a threatened species). We may also need to report the volume of work we did that day and where it was done.
Pencil and paper are one dimensional and cannot capture the kind of data we need for the work we do. Instead, we use a GIS tool called Collector. This digital tool allows the field crew to work with LIVE data, meaning as soon as we submit a data location, other field workers will be able to see it and access it immediately. Once the data is collected, staff can analyze the data, create maps to better understand what is happening at our restoration sites, and use the information to further streamline our conservation work.
The LCF staff uses Collector for a variety of data collection including:
- Tracking invasive species, human encroachment, bird nests, sensitive and endangered flora and fauna, field hazards (beehives, poison oak) and rare plants
- Setting locations for photo monitoring our Fuel Modification Zone sites, which allows staff to monitor how the site has progressed or changed year to year or season to season
- Determining locations for monitoring vegetation transect lines
- Identifying project boundaries to record what has been accomplished during a given time period.
- Querying data based on certain attributes crucial to the project success
GIS tools and the data they gather, and store not only tell a scientific story – a story needed to ensure our work is effective – GIS tools also can tell inspirational stories in a very rich and visual medium to share with the community.
Over the past 5 years, I have been studying GIS and have enjoyed creating maps and understanding the power of data communication through spatial characteristics and visualizations. So, if you’re not into strapping on snake gators or stumbling into some bush rue, take a journey with me, nonetheless, through the wonderful world of Story Maps, where I created a map with photos, locations and, yes, data, and click on our StoryMap on Restoring Aliso Creek.
Happy GIS Day!
